Last changed: 2023.07.01
This page will explain how to set up grafana based monitoring on a
single linux server without any docker or cloud usage.
In my opinion you don’t need a kubernetes setup for a single server, but
the documentation is lacking in explaining on how to set it up on “bare
metal linux”.
This page will explain on how to install it from standalone linux binaries only. This is quite easy to automate, setup and run.
I use node_exporter, mysql_exporter, prometheus and grafana - and none of those ever crashed. They are running for close to a year now without any problems. I started them inside a “screen” and since then they never died on me.
I have the default config of 14 days for data retention in prometheus, and all of my above mentioned applications plus 2 other golang web applications use around 2.3GB of storage space. This is quite acceptable, as it will never get higher than this.
A short summary for those who don’t know how grafana and prometheus work.
Grafana is only the front end and prometheus is the storage
backend.
Prometheus pulls metrics every 15 seconds (by default) and saves them.
This means you don’t send metrics but instead prometheus gets them from
your application. This also means that your application has to expose a
HTTP webserver where prometheus can get the metrics from.
These metrics, which are normally exposed at /metrics
(e.g. http://localhost:8080/metrics), are just a key-value pairing and
the values are all numbers.
An example for metrics are:
# TYPE process_cpu_seconds_total counter
process_cpu_seconds_total 8.59
# HELP go_threads Number of OS threads created.
# TYPE go_threads gauge
go_threads 9
The first one of those metrics is a counter. This counter can only go
up (by e.g. counter.Inc()) and measures e.g. total http requests
served.
The second metric is a gauge, a number that can go up and down. This for
example measures e.g. concurrent http requests being handled right
now.
Prometheus is a time series database, which means that Grafana (the frontend) can display these 15s interval data in a graph.
The XXX_exporter tools mentioned in the first paragraph are tools that monitor your e.g. linux system or mariadb database. These are premade services that enable you to easily monitor everything about your services, e.g. with linux the “open file descriptors” or “ram usage”.
Before installing please make sure that your firewall config is up to
date.
Your exporters, grafana and prometheus do not have to be available from
the internet, so block all ports you dont need.
In my setup I only have port 443 (HTTPS) open for grafana, because all other applications run on the same server so no port has to be opened.
Grafana is the UI frontend of the whole monitoring.
You can download it from here: https://grafana.com/grafana/download?pg=get&plcmt=selfmanaged-box1-cta1&edition=oss
To download it you can use
wget https://dl.grafana.com/oss/release/grafana-10.0.1.linux-amd64.tar.gz
tar -zxvf grafana-10.0.1.linux-amd64.tar.gz
To start it you can create a “startgrafana.sh” file containing this:
./grafana-10.0.1/bin/grafana server --homepath "grafana-10.0.1" webGrafana will run on port 3000 and the default login is admin/admin.
If you forget your password later you can use the following method to reset it back to admin/admin:
cd grafana-10.0.1
bin/grafana cli admin reset-admin-password admin
Grafana now runs on port 3000, but it would be better to run it behind a reverse proxy.
I personally use nginx so I did the following changes to be able to use grafana behind it.
Create a new file called “grafana.ini” and put the following configuration in it:
[server]
domain = example.com
root_url = https://example.com/grafana/
serve_from_sub_path = falseAttention: With Grafana 10 you have to set
serve_from_sub_path=false but with Grafana 9 you have to
set this to true.
Then change your “startgrafana.sh” file to add this config:
./grafana-10.0.1/bin/grafana server --config "grafana.ini" --homepath "grafana-10.0.1" webThis way grafana knows that it’s being called by a reverse proxy subpath and all the http connections will work.
For the nginx config I used the following to serve it in the “grana” subpath:
#grafana
location /grafana/ {
    rewrite ^/grafana/(.*) /$1 break;
    proxy_set_header Host $http_host;
    proxy_pass http://localhost:3000;
}
location /grafana/api/live/ {
    rewrite ^/grafana/(.*) /$1 break;
    proxy_http_version 1.1;
    proxy_set_header Upgrade $http_upgrade;
    proxy_set_header Connection $connection_upgrade;
    proxy_set_header Host $http_host;
    proxy_pass http://localhost:3000;
}
After restarting nginx you should be able to access grafana through your nginx instance.
My folder for grafana looks like this now:
$ ls -al
..
grafana-10.0.1
grafana.ini
startgrafana.sh
To run grafana “forever” I simply started a screen
(screen -S grafana) and inside that started the sh script
(./startgrafana.sh).
The node_exporter exports your linux server metrics like cpu usage, disk usage and ram usage.
Download it from here: https://github.com/prometheus/node_exporter/releases
To download it you can use:
wget https://github.com/prometheus/node_exporter/releases/download/v1.6.0/node_exporter-1.6.0.linux-amd64.tar.gz
tar -xvf node_exporter-1.6.0.linux-amd64.tar.gz
Then simply start it with:
./node_exporter-1.6.0.linux-amd64/node_exporterIt now listens on port 9100 and automatically serves your linux server metrics.
I ran this the same way as grafana: Create a screen and run it inside it.
The mysqld_exporter exports metrics about your databases’ health and unoptimized queries.
Download it from here: https://github.com/prometheus/mysqld_exporter
To download it you can use:
wget https://github.com/prometheus/mysqld_exporter/releases/download/v0.15.0/mysqld_exporter-0.15.0.linux-amd64.tar.gz
tar -xvf mysqld_exporter-0.15.0.linux-amd64.tar.gz
For this to work you need to create a database user with special permissions like this:
CREATE USER 'exporter'@'localhost' IDENTIFIED BY 'XXXXXXXX' WITH MAX_USER_CONNECTIONS 3;
GRANT PROCESS, REPLICATION CLIENT, SELECT ON *.* TO 'exporter'@'localhost';
Then create a config file for the exporter, e.g. “mysqld_exporter.cnf” and put your user and password of the db user into it:
[client]
user=exporter
password=XXXXXXXXXXXXXXXX
To start it I use this quite full shell script named “startmysql.sh”, which tells the program to export nearly everything:
./mysqld_exporter-0.15.0.linux-amd64/mysqld_exporter-main --config.my-cnf mysqld_exporter.cnf --collect.global_status --collect.info_schema.innodb_metrics --collect.auto_increment.columns --collect.info_schema.processlist --collect.binlog_size --collect.info_schema.tablestats --collect.global_variables --collect.info_schema.query_response_time --collect.info_schema.userstats --collect.info_schema.tables --collect.perf_schema.tablelocks --collect.perf_schema.file_events --collect.perf_schema.eventswaits --collect.perf_schema.indexiowaits --collect.perf_schema.tableiowaitsMy folder now looks like this:
$ ls -al
..
mysqld_exporter-0.15.0.linux-amd64
mysqld_exporter.cnf
startmysql.sh
To run it I simply create a screen again and run it with
./startmysql.sh inside it.
Now to start the actual monitoring. Prometheus scrapes your exporters / metrics every 15 seconds and saves the data in its time series database.
Download it from here: https://prometheus.io/download/
You can download it with:
wget https://github.com/prometheus/prometheus/releases/download/v2.45.0/prometheus-2.45.0.linux-amd64.tar.gz
tar -xvf prometheus-2.45.0.linux-amd64.tar.gz
Prometheus has its entire scrape config (aka. which targets it pulls metrics from) in a single YAML file.
We currently have 4 scrape targets we can use:
This means our prometheus.yml file looks like this:
global:
  scrape_interval:     15s
  evaluation_interval: 15s
scrape_configs:
  - job_name: prometheus
    static_configs:
      - targets: ['localhost:9090']
  - job_name: grafana
    static_configs:
      - targets: ['localhost:3000']
  - job_name: linux
    static_configs:
      - targets: ['localhost:9100']
  - job_name: mariadb
    static_configs:
      - targets: ['localhost:9104']
By default prometheus scrapes the /metrics route of all the targets configured.
To now start prometheus I have a simple “startprom.sh” script that contains:
./prometheus-2.45.0.linux-amd64/prometheus --config.file=prometheus.ymlMy folder looks like this now: $ ls -al .. prometheus-2.45.0.linux-amd64 prometheus.yml startprom.sh
To start it I run it in a simple screen with
./startprom.sh.
Now that prometheus and grafana are running you can add prometheus as your data source in grafana.
In Grafana v9 go to the bottom left corner Administration -> Data sources, in Grafana v10 go to the top left and Administration -> Data sources.
Click on add new one and Prometheus.
Here you can simply enter the default “http://localhost:9090” Prometheus
server url and it should work.
Click on “Save & test” at the bottom.
Now you can, for example, go to the left side “Explore” section and explore the Prometheus data source. There should be a lot of metrics already, e.g. go_mestats_mallocs_total.
You can also add your database as a data source. This way you can execute database queries and display them on your dashboard. This is not recommended by security though, as you could run INSERT or DELETE queries this way and changing production data from your monitoring is not the best security practise.
I won’t go into detail on how to create dashboards as that is a whole new world by itself.
Adding prometheus capabilities for metrics to your golang application is quite easy. You simply have to build a middleware that counts your metrics and use it first before other routes.
My commit for adding this to a golang gin-gonic rest server, to easily compare what has been added: https://github.com/OverlordAkise/istina/commit/5631dd7f70ee7c15e91d0d489f50fe5799cfa598
The promhttp package by itself has only metrics about
your internal golang application, e.g. ram and cpu usage, but not about
your http webserver metrics.
There may be packages out there that easily let you add support for
gin-gonic metrics, but I decided to only build in what I need.
An example cutout of the code commit above:
At the beginning you create your prometheus “counters”, e.g.:
requestCounter := prometheus.NewCounterVec(
    prometheus.CounterOpts{
        Namespace: "myapp",
        Name:      "http_requests_total",
        Help:      "Number of received http requests",
    },
    []string{"code", "method", "host", "url"},
)
prometheus.MustRegister(requestCounter)
Then you create a middleware. This middleware should be created and used before any other route or middleware has been added, so that it can measure all of the application:
r.Use(func(c *gin.Context) {
    c.Next()
    if c.Request.URL.Path != "/metrics" && c.Request.URL.Path != "/favicon.ico" {
        requestCounter.WithLabelValues(status, c.Request.Method, c.Request.Host, c.Request.URL.Path).Inc()
    }
})
Now, everytime a request comes in, this middleware gets called. It lets the request through by calling c.Next() and after the request bubbles up the stack again it increments the counter of “requestCounter” with the specified Method/Host/Path labels.
To now expose this we will create a /metrics route.
By default promhttp expects a default “net/http” golang route function,
with “w writer” and “r response” parameters.
We can do this with gin-gonic by wrapping it like this:
r.GET("/metrics", gin.WrapH(promhttp.Handler()))Now your application is ready and can be scraped by prometheus.
Every prometheus metric-source has an up metric that is
available to view in grafana.
You can view this metric in grafana by going to Explore on
the left and then simply typing in up and pressing
shift+enter.
This metric will be 1 if the service was able to be scraped
(=accessed) by prometheus and will be 0 if Prometheus wasn’t able to
access the /metrics path.
This metric has a different label (job) for each service.
You can easily monitor your services (in general, if they are
running) by creating an alert with the up metric.
On the left menu you have an “Alerting” tab. There you can create
“Contact points” (the place where you will get your is-down
notification) and “Alert rules” (the checks that send
notifications).
You can create an alert rule with the following:
upThis way your alert rule will check every 5 minutes if a service is down. If it is down for 2 checks in a row (e.g. 10 minutes) then you will get a notification.
The above commit shows a “HistogramVec”, so a bucket-based metric
with different labels.
This means there are a set of buckets for every label combination. This
is nice to have for detailed analysis, but for simple graphs you can
combine all buckets into one.
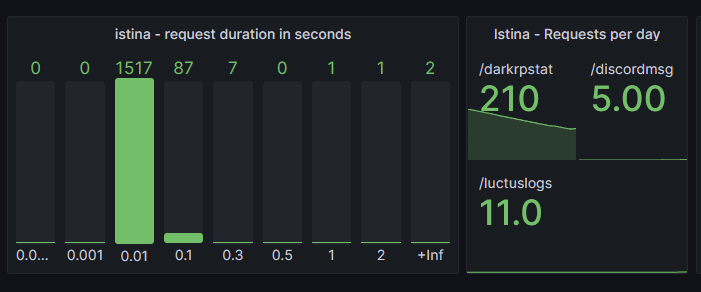
To display this in grafana I recommend the usage of the “Bar Gauge” type.
Create a new panel and set the type to “Bar gauge”.
In the QL field enter your bucket metric,
e.g. “myapp_http_duration_seconds_bucket”.
If your code is exactly like mine, then you will see multiple “0.01” and multiple “+inf” buckets, one for each label combination (e.g. one set of buckets for each HTTP route).
This is quite big and not easily readable, so I prefer to just combine them into one.
In the QL field instead enter:
sum by (le) (myapp_http_duration_seconds_bucket)This way all buckets will be summarized, so you only have one “+inf” and one “0.01” bucket displayed.
To change the labels open the “options” panel at the bottom and in
the “Legend” field enter {{le}}.
I have 3 main routes but my bucket bar gauge is now displayed as one:
Loki is the logging backend that has to be added as a data source in
grafana.
Promtail is the “log-grabber” that basically uses tail -f
to send the log files you specify to loki.
To install loki and promtail first download them from here: https://github.com/grafana/loki/releases
Example:
wget "https://github.com/grafana/loki/releases/download/v2.9.2/loki-linux-amd64.zip"
wget "https://github.com/grafana/loki/releases/download/v2.9.2/promtail-linux-amd64.zip"
unzip loki-linux-amd64.zip
unzip promtail-linux-amd64.zip
An example loki config, taken from https://grafana.com/docs/loki/latest/configure/examples/#1-local-configuration-exampleyaml
This will be put into loki.yaml in the loki folder:
auth_enabled: false
server:
  http_listen_port: 3100
common:
  ring:
    instance_addr: 127.0.0.1
    kvstore:
      store: inmemory
  replication_factor: 1
  path_prefix: /tmp/loki
schema_config:
  configs:
  - from: 2020-05-15
    store: boltdb-shipper
    object_store: filesystem
    schema: v11
    index:
      prefix: index_
      period: 24h
To start loki simply use the following command from within the loki folder:
./loki-linux-amd64 --config.file=loki.yamlAn example promtail config, taken from https://grafana.com/docs/loki/latest/send-data/promtail/configuration/#example-static-config
This will be put into promtail.yaml in the promtail
folder:
server:
  disable: true
positions:
  filename: ./positions.yaml
clients:
  - url: http://localhost:3100/loki/api/v1/push
scrape_configs:
 - job_name: myapp
   pipeline_stages:
   static_configs:
   - targets:
      - localhost
     labels:
      app: myapp
      __path__: /srv/myapp/myapp.log
In this example configuration I changed the server to be disabled. This server is meant to receive logs via http push, which is not needed if you simply tail the logfiles.
To start promtail simply use the following command from within the promtail folder:
./promtail-linux-amd64 -config.file promtail.yamlNow all that is left is to add the loki data source in grafana, which can be done with the url “http://localhost:3100”.
I have now used grafana loki for close to a year. It is similar to
Elasticsearch.
It is still, in my opinion, not a good replacement for all the features
and performance of Elasticsearch, BUT it is a very good small scale
logging server solution for non-enterprise.
Promtail can handle log rotation and never had any problems with
getting and sending my application logs to loki.
Loki is sometimes slow to query (if you search quickly and mulitple
times in a row) but works quite well for me, a single person using it
and with ~7 services logging to it. The fact that loki doesn’t index
text never bothered me as the queries were still fast no matter what I
searched for.
All in all, I can recommend using Loki and Promtail for your personal logging needs. It uses way less RAM and CPU than e.g. Elasticsearch and works well with my logging setup of only 7 applications. I would not recommend it for enterprise logging with many machines.
Loki is not enterprise ready yet.
My pain points with this logging solution:
Promtail is a must have
They expect you to use promtail for sending logs to loki. There is no
official solution for sending logs directly out of your application or
via other log-pushers to loki. This means another application like
promtail makes your whole landscape even more complex to manage.
Promtail also only handles files,pods and journal as a log source, which
means no stdout support as far as I know.
Promtail can’t handle log rotation
According to https://grafana.com/docs/loki/latest/clients/promtail/.
If I have logging in my applications I have to rotate them out before
they become too big and clog the filesystem. But promtail, the official
tool for loki, doesn’t support this, which means it’s very difficult to
use anywhere. (This seems to, as of 2023.11.13, to work?)
Promtails config is weird
This may be subjective, but having this weird config setup with a
“path” variable inside the targets->labels block to
signal what log file I want to tail is neither easy to read nor easy to
configure. I also have to add “localhost” as a target, even though
promtail can only read files from your local machine. (?!)
Expectation of cloud usage
Both loki and promtail have only documentation about cloud usage.
Finding an easy to follow guide to install this locally on a single
bare-metal linux server is not easy, but for e.g. Kubernetes I would use
elasticsearch and their stack anyways.
Loki doesn’t index text
Loki only indexes the labels and not the message itself.
This means you have to add lots of labels for easy and quick log
searching, but loki wants you to have non-dynamic labels (e.g. a fixed
amount of possible labels) which makes this more difficult again.
This means a “correlation ID” as a label doesn’t work because it is
different for every request, of which you have thousands a minute.